Chart Examples
Column Chart
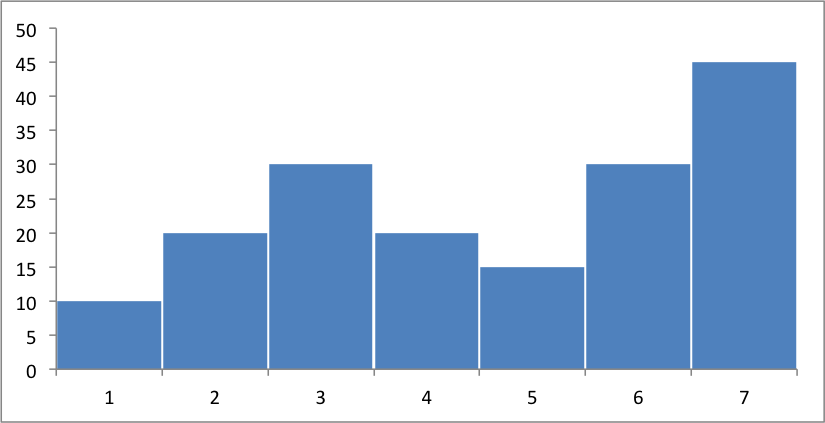
Create a simple column chart:
...
# Create a chart object.
chart = workbook.add_chart({'type': 'column'})

# Configure the series of the chart from the dataframe data.
chart.add_series({
   'values':     '=Sheet1!$B$2:$B$8',
   'gap':        2,
})

# Configure the chart axes.
chart.set_y_axis({'major_gridlines': {'visible': False}})

# Turn off chart legend. It is on by default in Excel.
chart.set_legend({'position': 'none'})
...
The output from this program exported from Excel as an image is:
Instead of the Excel style range notation, you can use the following list syntax which is easier to create programmatically:
chart.add_series({
    'values':     ['Sheet1', 1, 1, 7, 1],
    'gap':        2,
})
Excel refers to this type of histogram chart as “Column” charts.
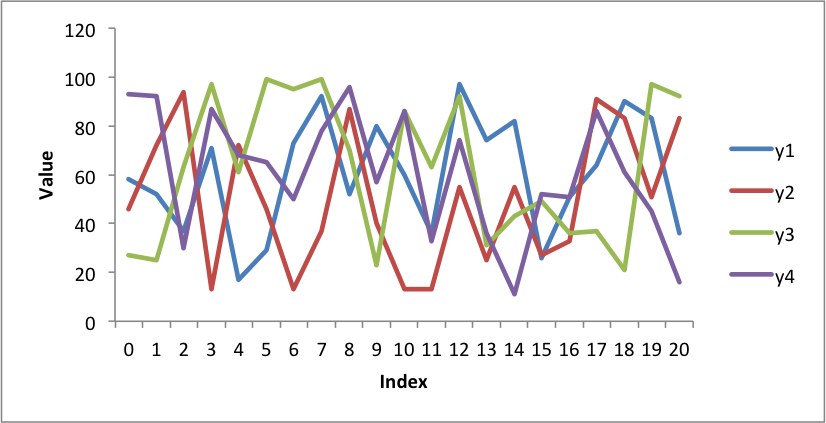
Axis Labels
Adding labels to the chart axes is easy:
chart.set_x_axis({'name': 'Index'})
chart.set_y_axis({'name': 'Value', 'major_gridlines': {'visible': False}})
You can also rotate the axis numbers:
chart.set_x_axis({'name': 'Index', 'num_font': {'rotation': 45}})
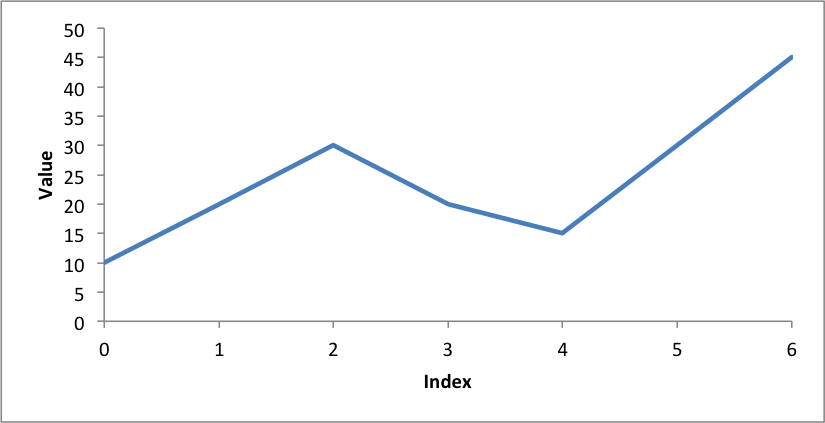
Line Chart
Create a simple Line chart:
chart = workbook.add_chart({'type': 'line'})
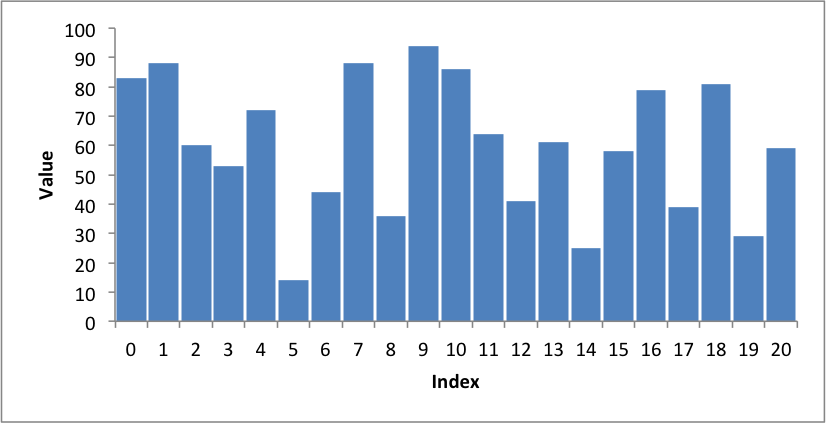
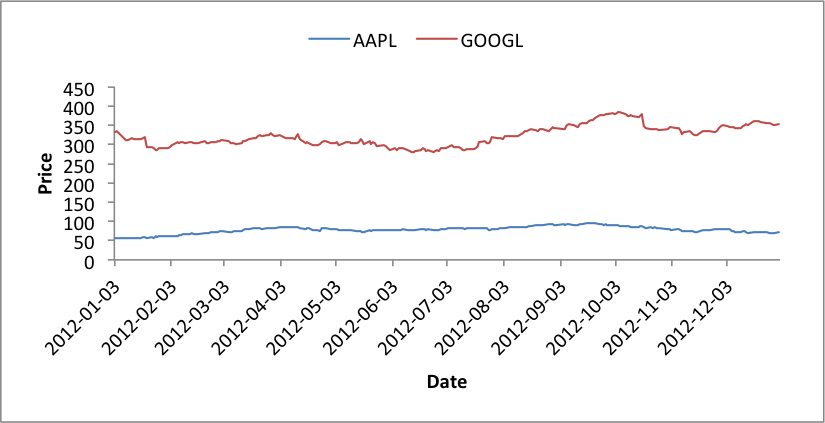
Legends
Excel adds a legend to a chart by default:
We can also turn the chart legend off, like the previous examples, or position the legend.
The following is an example using stock data and positioning the legend at the top of the chart:
chart.set_legend({'position': 'top'})
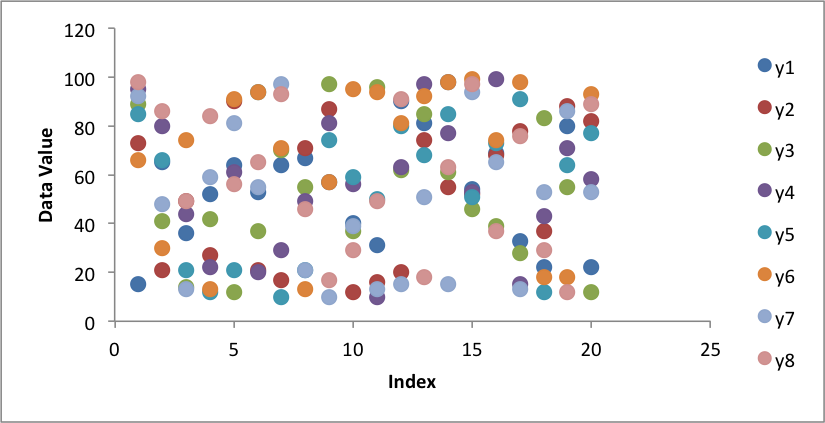
Scatter Chart
Create a simple scatter chart.
Rather than use Excel’s default symbols for each data series we set each one to be a circle:
chart.add_series({
  # ...
  'marker':     {'type': 'circle', 'size': 7},
})
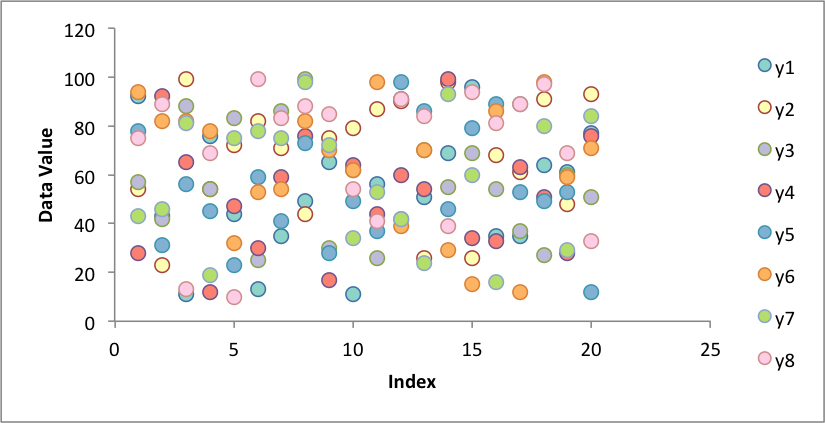
Colours
Colours are configurable for almost all aspects of XlsxWriter charts. In the following example we borrow the Color Brewer colours from Vincent and apply them to a scatter chart:
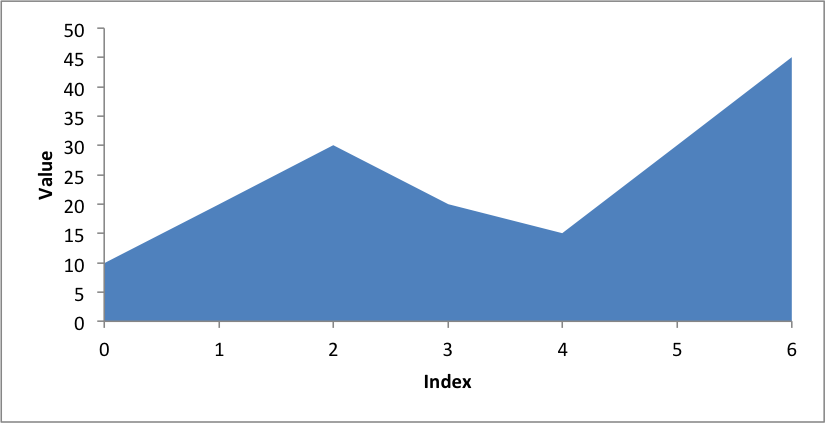
Area Chart
Create a simple Area chart:
chart = workbook.add_chart({'type': 'area'})
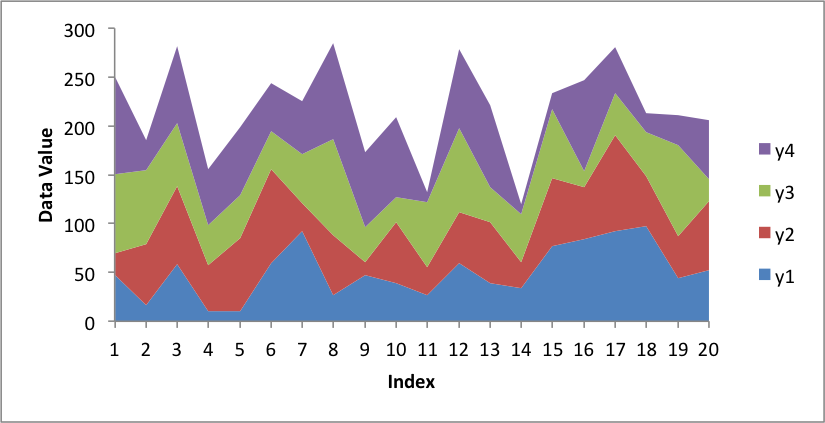
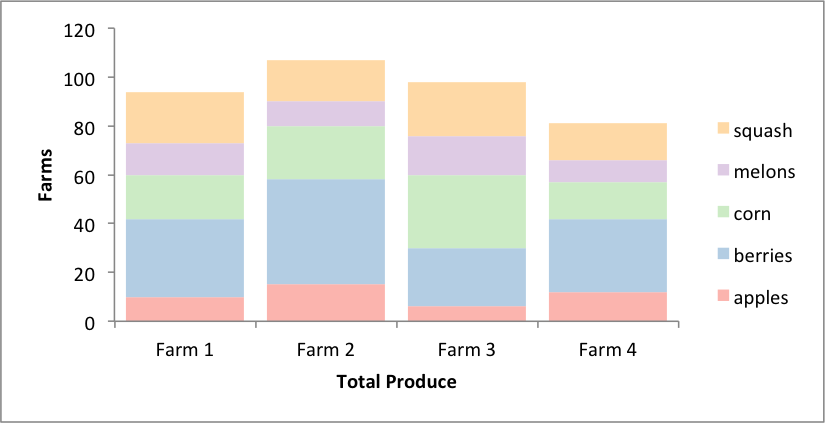
Stacked Area Chart
A Stacked Area chart is a subtype of an Area chart in Excel:
chart = workbook.add_chart({'type': 'area', 'subtype': 'stacked'})
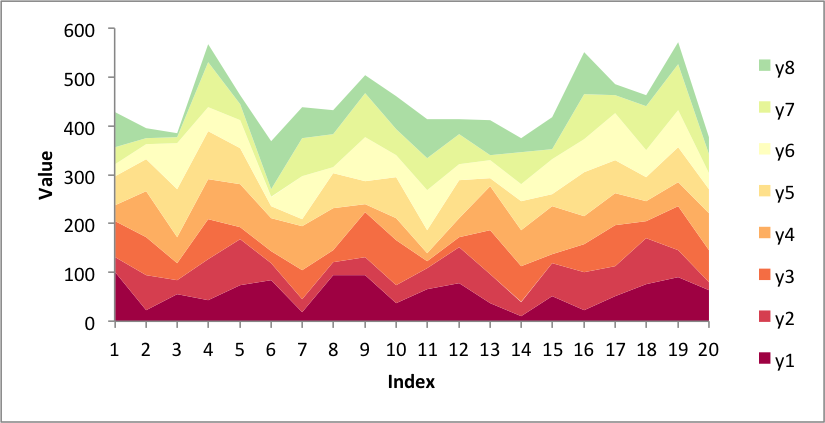
Or with more categories and the ‘Spectral’ colorbrew scheme from Vincent:
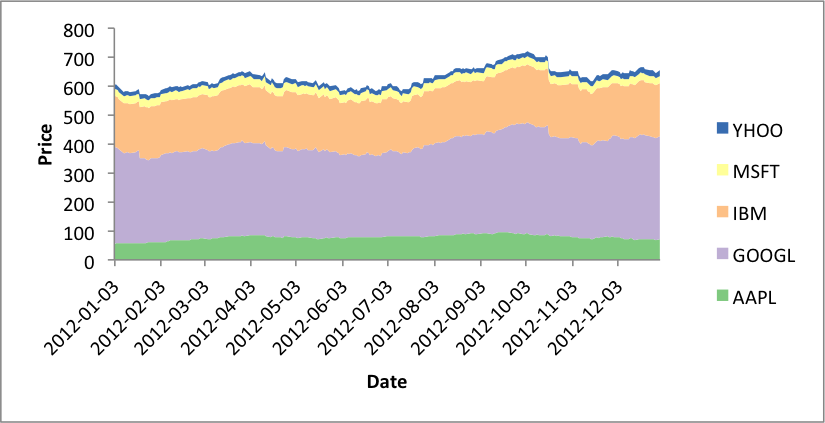
Or with stock data and the ‘Accent’ colorbrew scheme:
Stacked Column Chart
A Stacked Column chart is a subtype of an Column chart in Excel:
chart = workbook.add_chart({'type': 'column', 'subtype': 'stacked'})
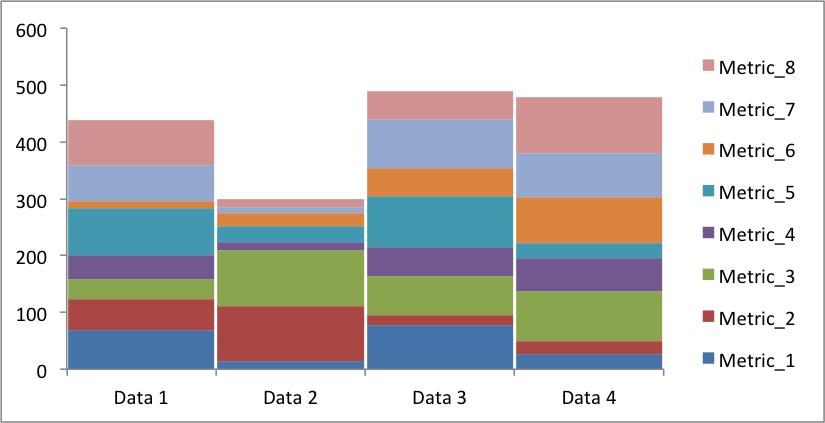
Or with different data and a wider gap:
Grouped Column Chart
A Grouped Column chart is the default Column chart in Excel:
chart = workbook.add_chart({'type': 'column'})
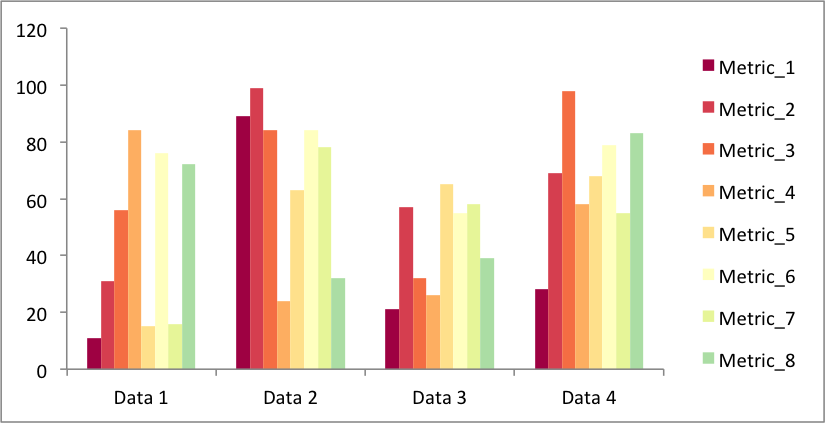
Or with the farm data from above:
Pie Chart
Create a simple Pie chart with user defined colours:
chart = workbook.add_chart({'type': 'pie'})
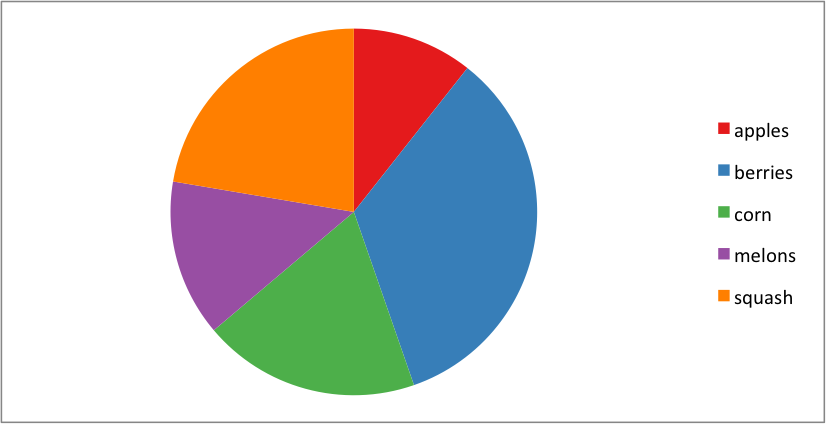
Chart Images
The images shown above were all exported from Excel for Mac 2011 using files created with Pandas and XlsxWriter.
The example programs and output files are on GitHub.